Description:
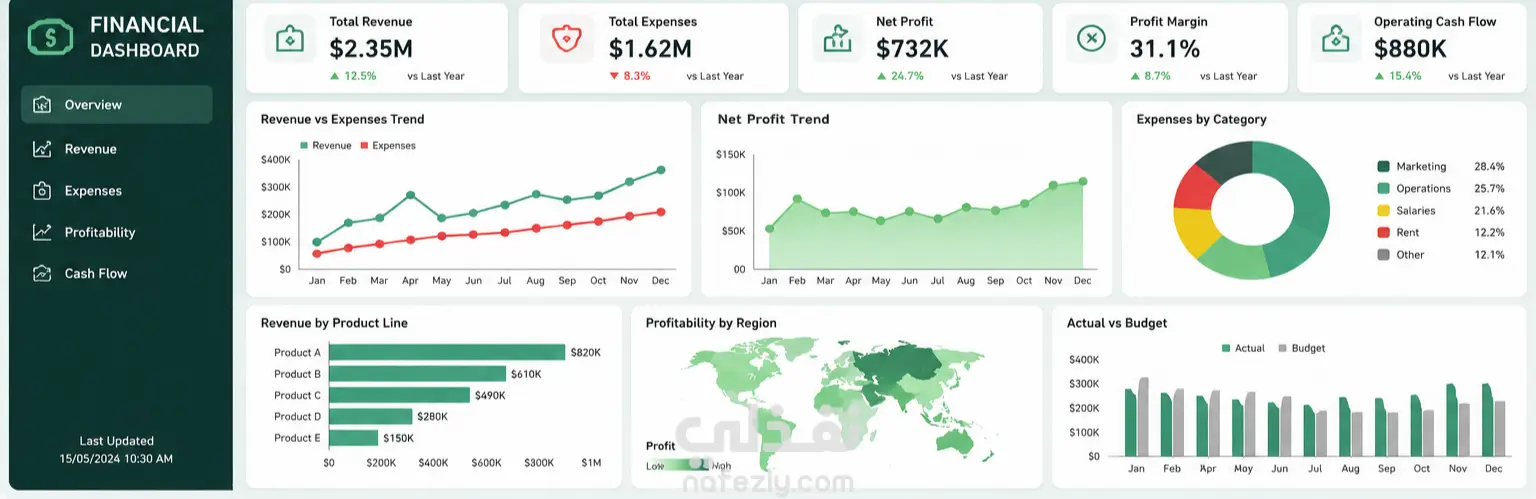
Design and development of an interactive Financial Dashboard designed to monitor corporate financial health, tracking revenues, expenses, net profit, cash flow, and departmental budgets.
Tools & Technologies Used:
Python: For data cleaning, preprocessing, and exploratory data analysis (EDA).
Power BI: For building the interactive data model, DAX measures, and visualizing the final dashboard.