In this project, I worked on the full data analysis process starting from:
✅ ETL & Data Cleaning
✅ Understanding the business requirements and dataset
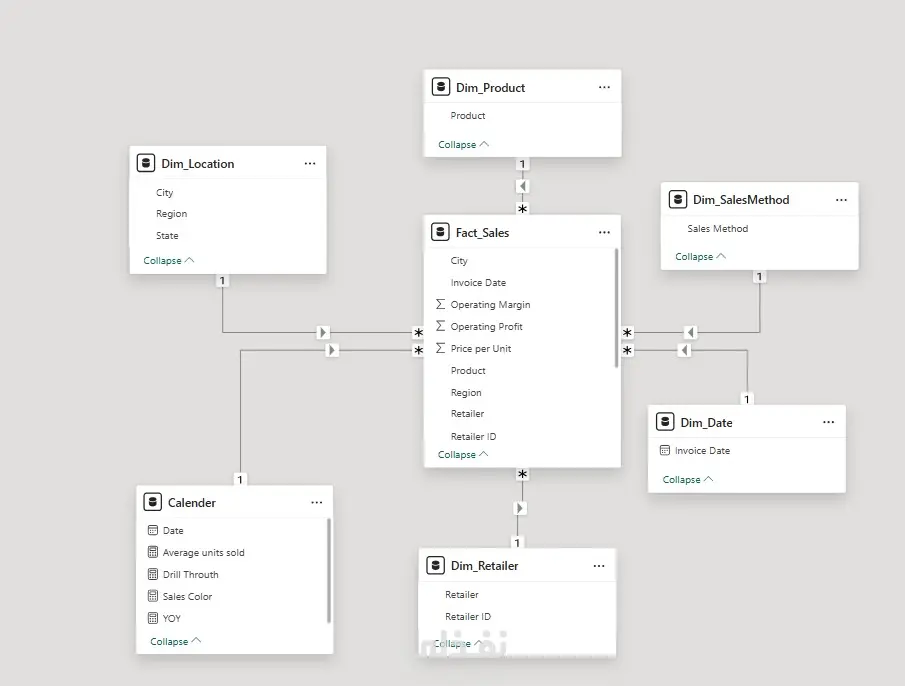
✅ Data Modeling & Building Relationships between tables
✅ Creating interactive dashboards and KPIs
✅ Turning raw data into actionable insights
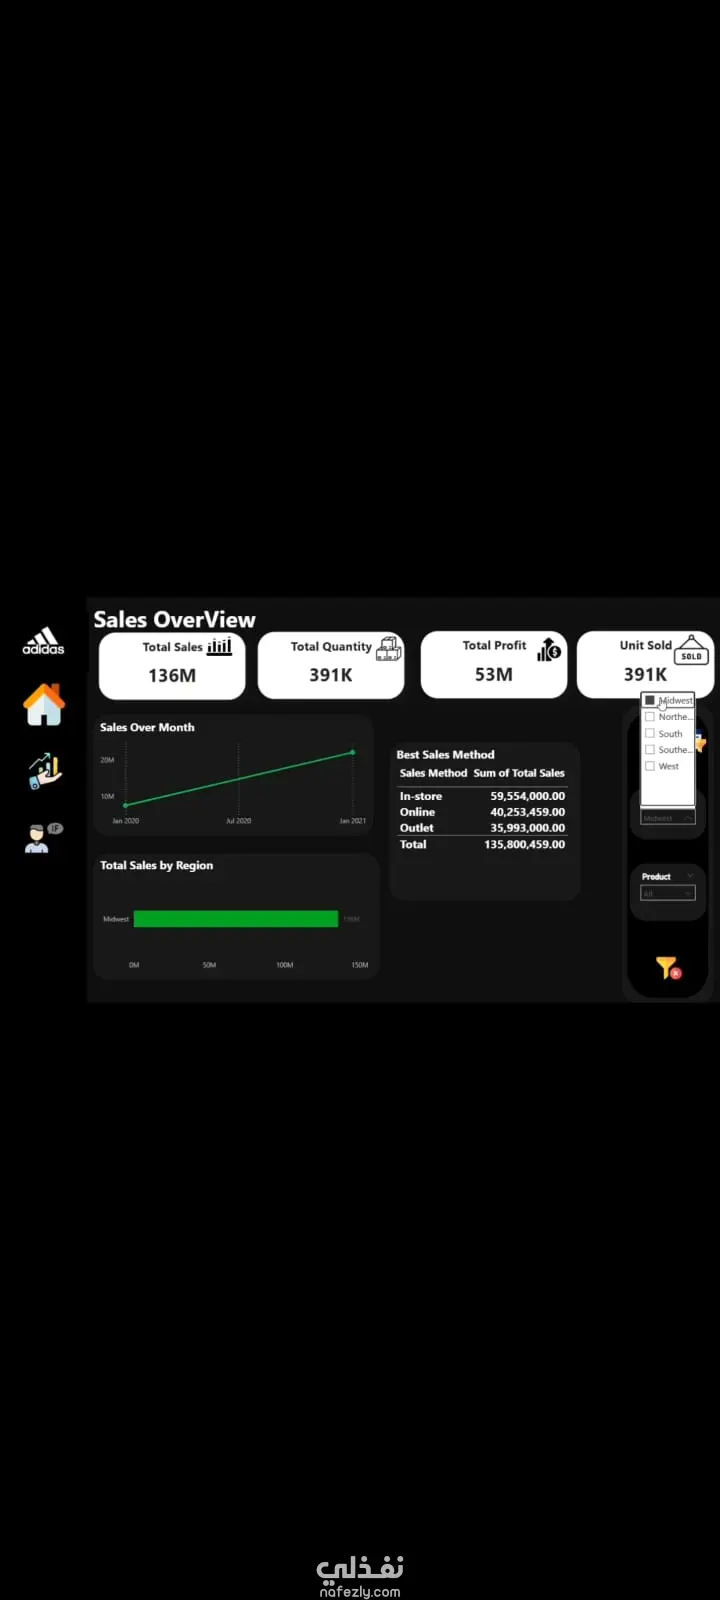
The dashboard includes key business metrics such as:
📌 Total Sales
📌 Total Profit
📌 Units Sold
📌 Quantity Analysis
📌 Regional & Product Performance
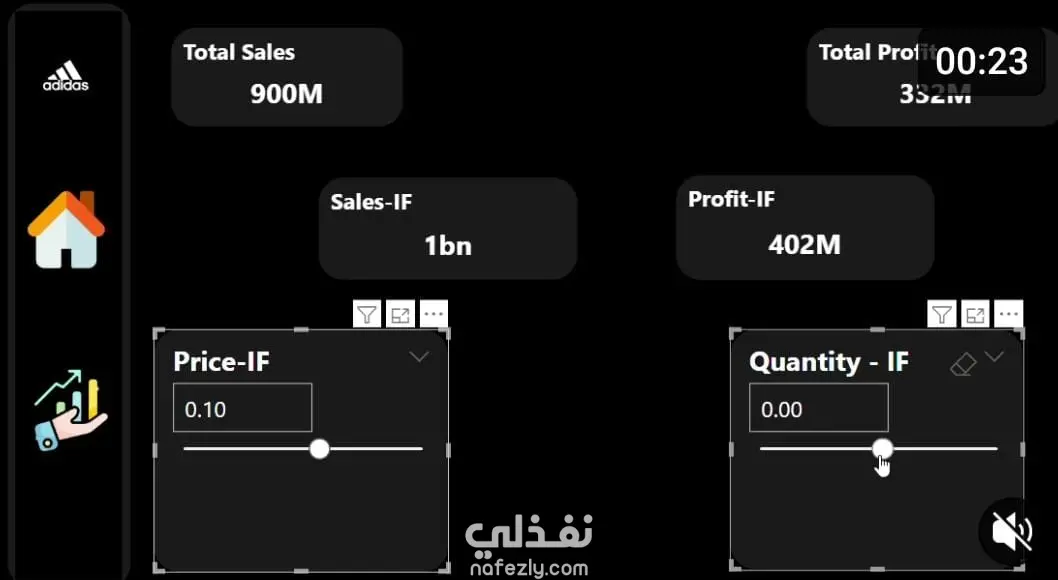
I also implemented a What-If Analysis feature to help management simulate different business scenarios and measure the impact on KPIs dynamically. This allows decision-makers to explore how changes in pricing or quantity can affect sales and profit performance.
Through this project, I focused not only on visualization but also on creating a clean data model and delivering meaningful insights that support business decisions.
Tools & Skills Used:
🔹 Power BI
🔹 Power Query
🔹 DAX
🔹 Data Modeling
🔹 ETL Process
🔹 Business Intelligence & Data Analysis