Project Description
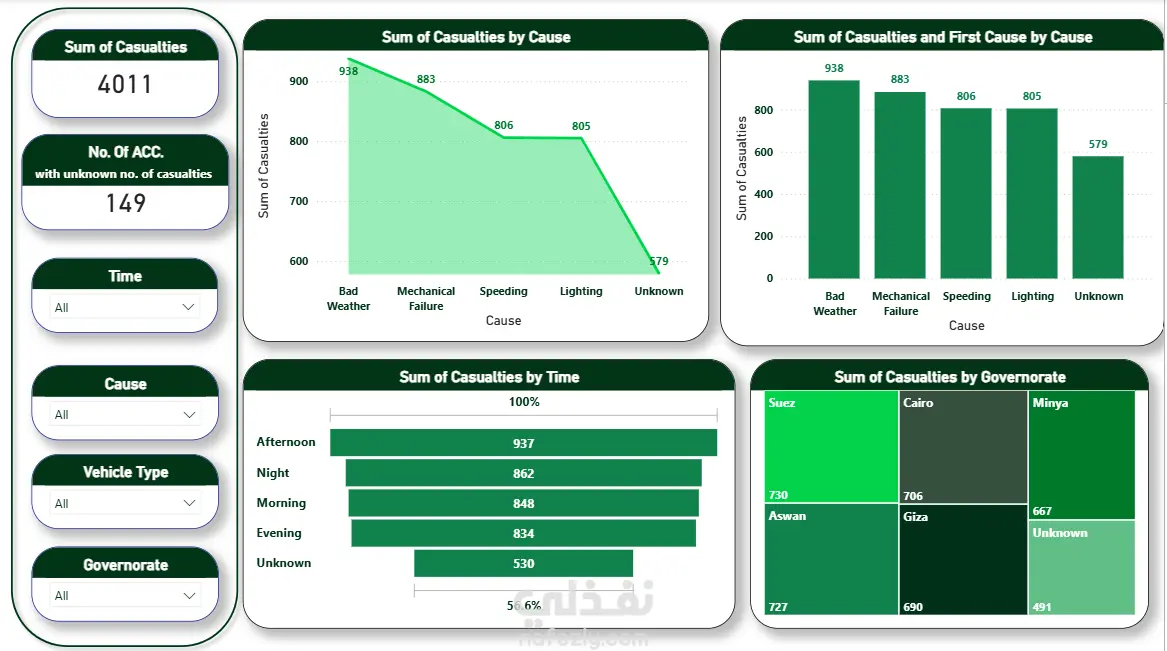
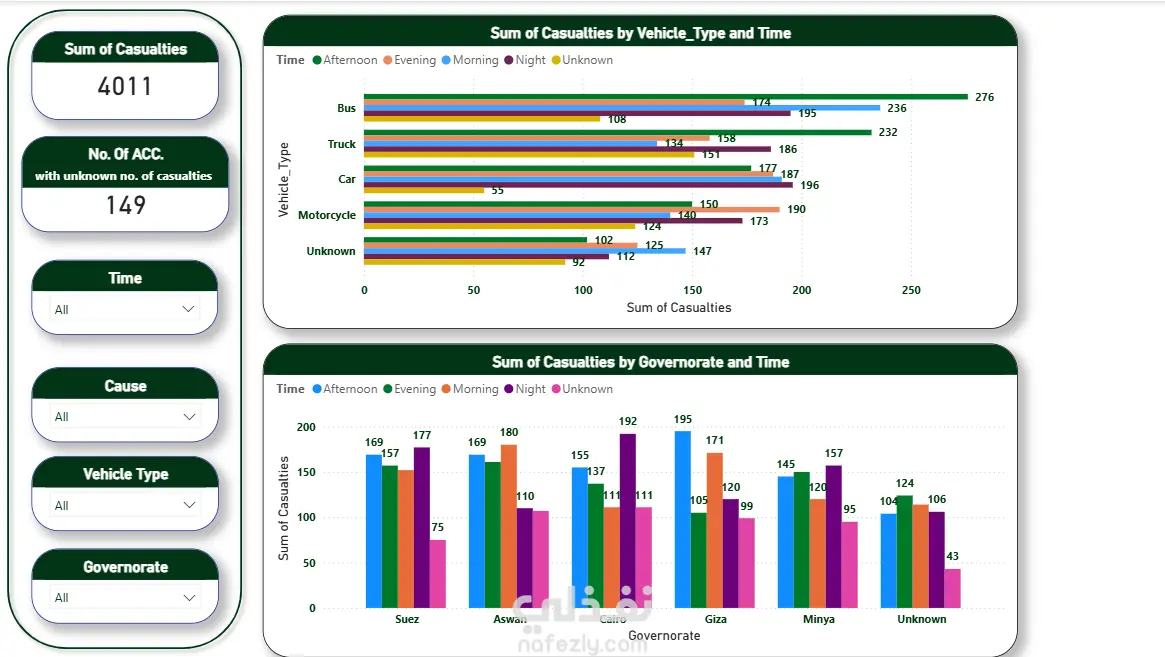
Built an interactive Road Accidents Dashboard using Power BI to analyze road accident casualties from different perspectives. The dashboard provides dynamic filtering by Time, Cause, Vehicle Type, and Governorate, allowing users to explore accident trends and identify the main factors contributing to road casualties.
Key Insights
The dataset contains 4,011 total casualties.
Bad Weather is the leading cause of casualties (938), followed by Mechanical Failure (883), while accidents with unknown causes recorded the lowest number.
The Afternoon has the highest number of casualties (937), indicating that this period experiences the greatest accident impact.
Suez recorded the highest number of casualties among the analyzed governorates, followed by Aswan and Cairo.
Buses were involved in the highest number of casualties across different time periods, while motorcycles and cars also contributed significantly.
The dataset includes 149 accidents with an unknown number of casualties, highlighting the presence of missing data that may affect analysis accuracy.
Recommendation
The analysis suggests prioritizing road safety during bad weather, improving vehicle maintenance inspections, and increasing traffic monitoring during afternoon hours. Special attention should also be given to high-risk governorates and public transportation vehicles to help reduce accident casualties