HR Analytics Dashboard | Power BI
تفاصيل العمل
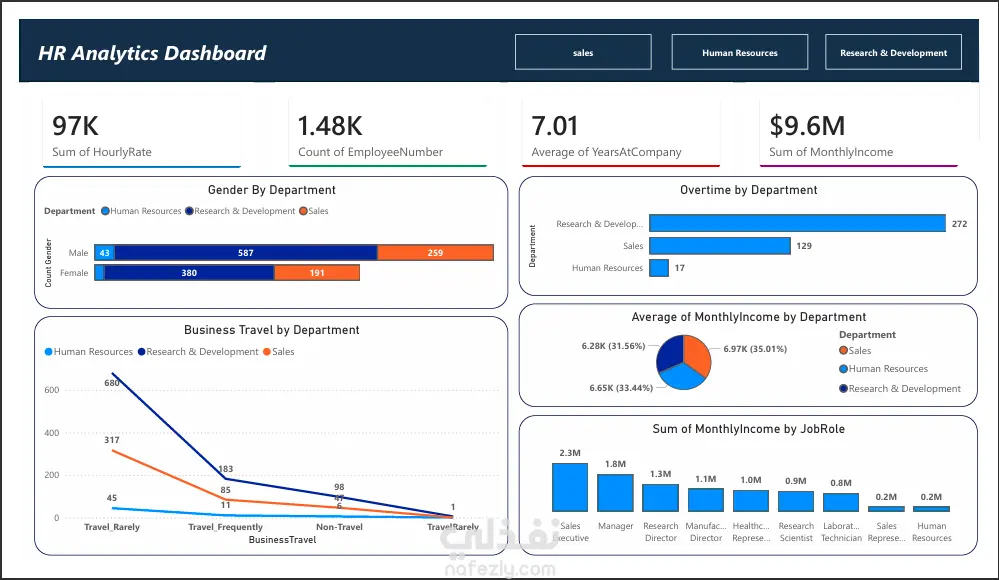
Developed an interactive HR Analytics Dashboard using Power BI, connected directly to an Excel data source and engineered a full data preparation pipeline using Power Query before building the visuals. 🔄 Data Pipeline (Excel → Power Query → Power BI): • Connected to raw Excel HR data as the primary data source • Cleaned the dataset by handling missing values and removing duplicates • Transformed columns and corrected data types to ensure accuracy • Merged and appended multiple tables to build a unified data model 📊 Dashboard Highlights: • Gender Distribution by Department — visualizing workforce diversity across all teams • Overtime Analysis by Department — identifying departments with the highest overtime load (R&D: 272 employees) • Business Travel Patterns — tracking travel frequency trends across departments • Monthly Income by Job Role — comparing compensation across roles • Average Monthly Income by Department — breaking down salary distribution per department 🛠️ Tools & Skills Used: Power BI | Power Query | DAX | Data Modeling | Data Cleaning | HR Analytics This dashboard enables HR teams and decision-makers to monitor workforce trends, identify potential burnout risks, and make data-driven decisions efficiently.
مهارات العمل