Exploratory Data Analysis
تفاصيل العمل
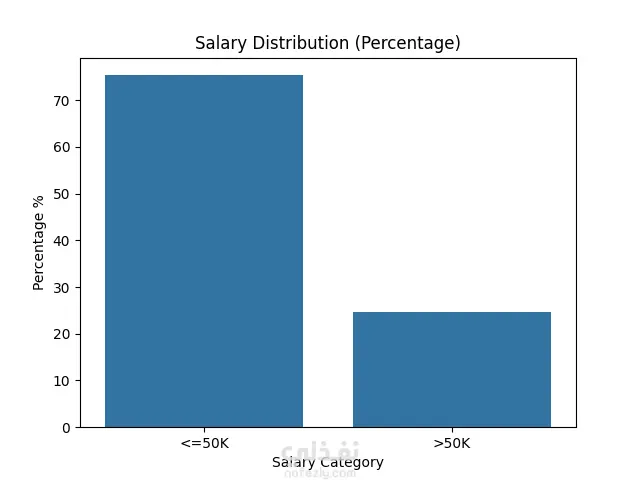
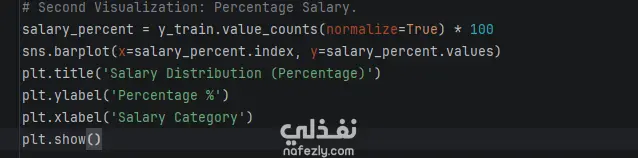
Salary Distribution (Percentage): A percentage-based bar chart was created to visualize the fundamental class imbalance within the dataset. Viewing the distribution as a percentage highlights the baseline probability of an individual falling into the <=50K versus >=50K category. This imbalance justified the use of stratified sampling during the train-test split to ensure the models learned from a mathematically representative sample, figure 2.
مهارات العمل
بطاقة العمل

طلب عمل مماثل




