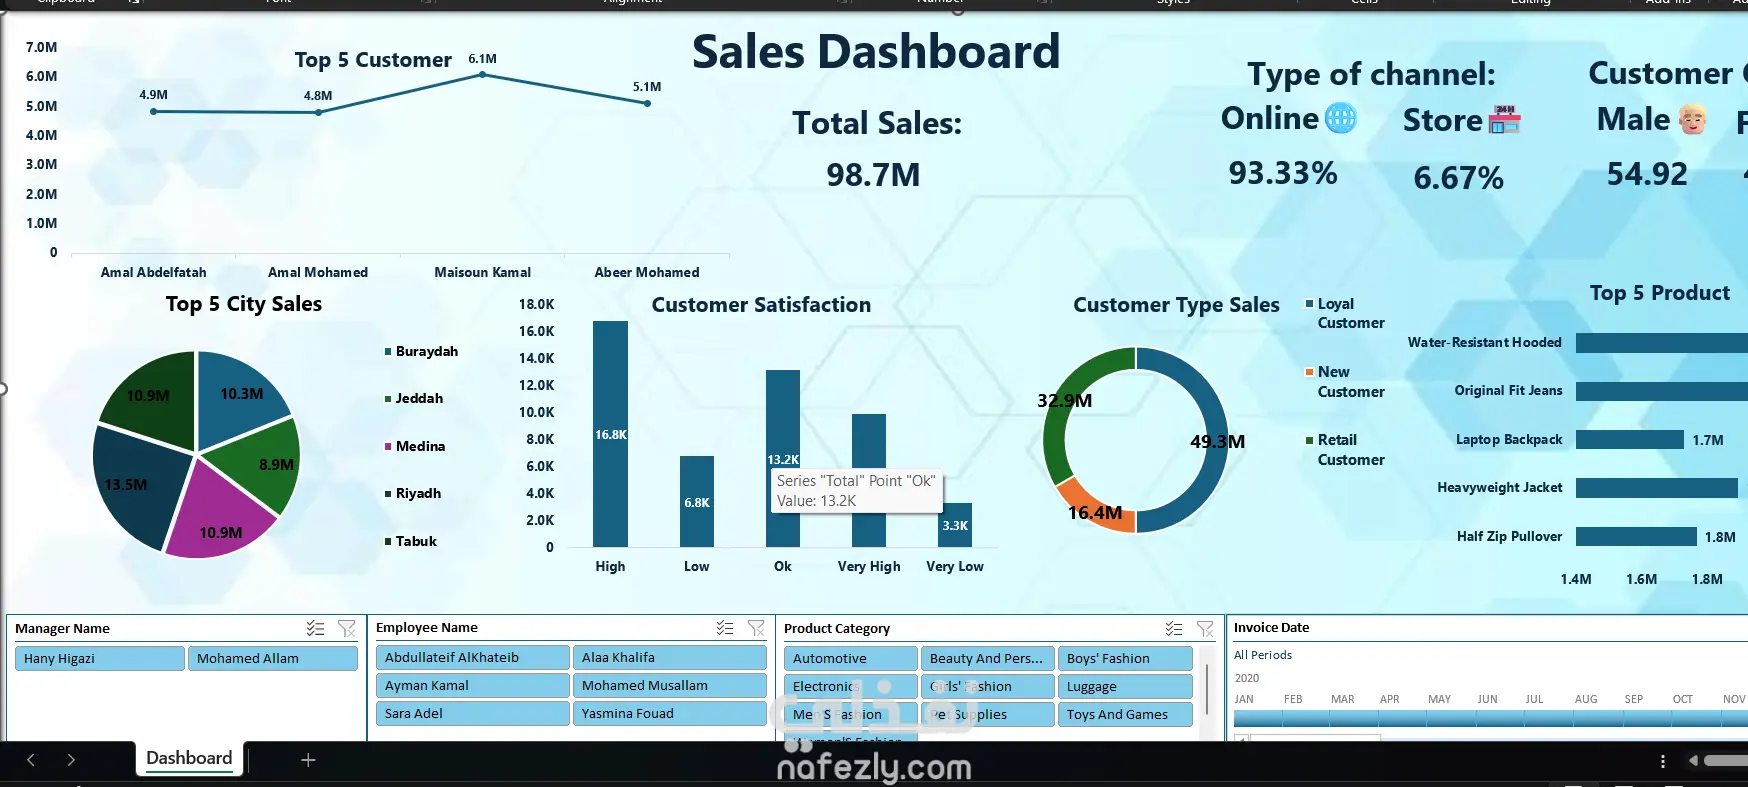
A comprehensive, interactive Excel dashboard focused on analyzing retail sales channels, product performance, and customer demographics. This tool delivers a 360-degree view of business operations, helping stakeholders track customer satisfaction and optimize sales strategies.
Key Metrics Tracked (KPIs):
Total Sales: $98.7M (High-scale revenue performance tracking).
Sales Channel Split: Online Sales (93.33%) vs. Store Sales (6.67%).
Customer Demographics: Gender Distribution (54.92% Male vs. 45.08% Female).
Top 5 Customers: Dynamic line chart identifying peak buyers (up to $6.1M).
Visualizations & Insights Included:
Top 5 City Sales: A clear pie chart breaking down revenue across key regional markets (Buraydah, Jeddah, Medina, Riyadh, and Tabuk).
Customer Satisfaction Metrics: A column chart measuring customer feedback levels (High, Low, OK, Very High, Very Low) to gauge service quality.
Customer Type Sales: A donut chart segmenting revenue contribution by customer profile (Loyal, New, and Retail Customers).
Top 5 Product Categories: A horizontal bar chart showcasing best-selling apparel items (such as Water Resistant Hooded, Original Fit Jeans, Laptop Backpack, etc.).
Technical Features:
Highly functional data architecture featuring interactive Excel Slicers for deep diving into data by Employee Name, Product Category, and Invoice Date.
Modern, clean, and corporate light-themed user interface (UI) designed for executive reporting.
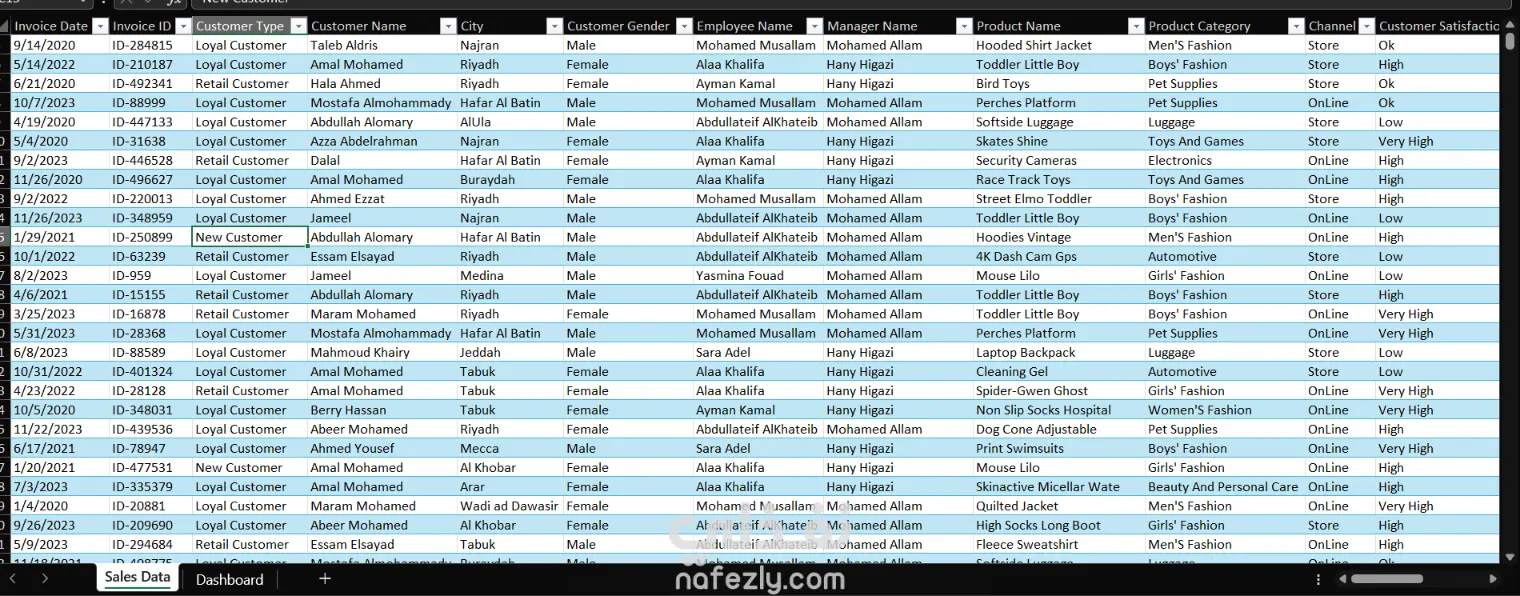
Seamless connection between raw database tabs (Sales Data) and the visual presentation interface (Dashboard).