project by Excel
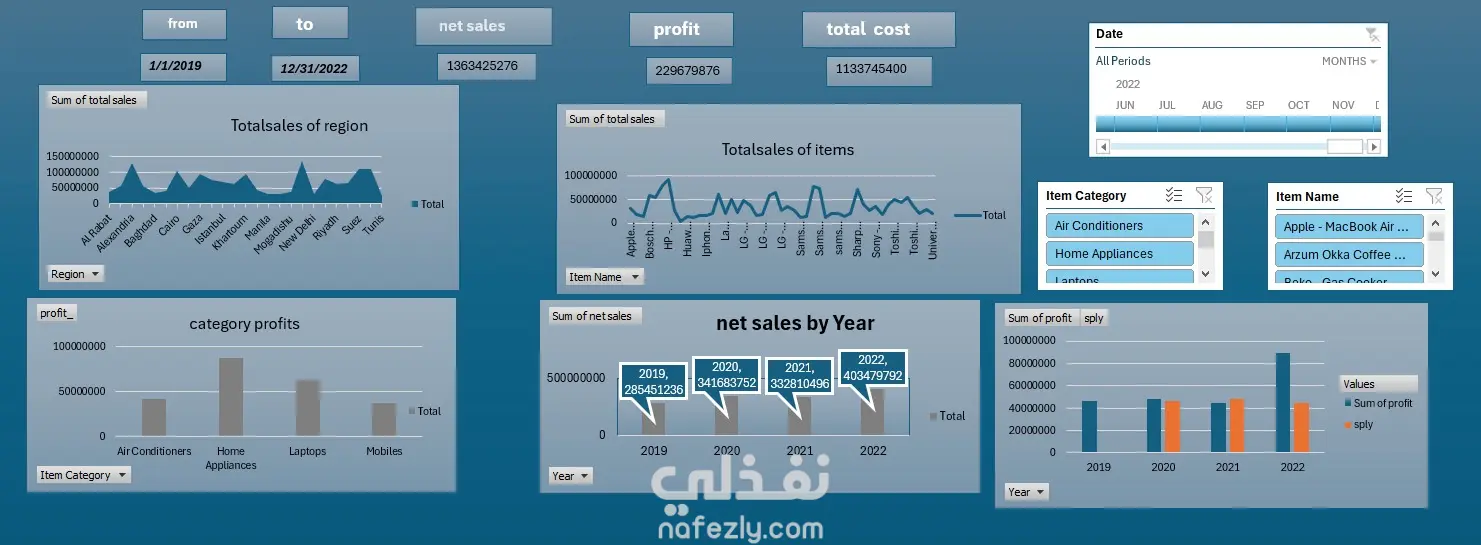
تفاصيل العمل
Sales Performance & Revenue Analytics Dashboard (2019–2022) Built a multi-year revenue analytics dashboard using Microsoft Excel, analyzing 4 years of sales data for an electronics and home appliances trading company. The project involved data modeling across multiple sources including revenue transactions, customer master data, price lists, and sales targets. Key contributions: Designed and built interactive PivotTables and PivotCharts to track net sales, profit margins, and year-over-year (YoY) growth across 4 fiscal years Analyzed over $1.3B in total revenue with an average profit margin of 16.8% Performed customer ranking analysis, identifying top accounts such as Local Agent ($110M) and AMC Trade ($90M) Conducted city-level sales distribution analysis across Alexandria, Suez, and Cairo Built product performance breakdowns, identifying HP Core i7 Laptop as the top-selling product at $92M Compared same-period last year (SPLY) performance to identify growth trends and seasonal patterns Tools: Microsoft Excel — PivotTables, PivotCharts, Slicers, Dashboard Design
مهارات العمل
بطاقة العمل

طلب عمل مماثل




