تصميم لوحات تحكم تفاعلية احترافية باستخدام Excel
تفاصيل العمل
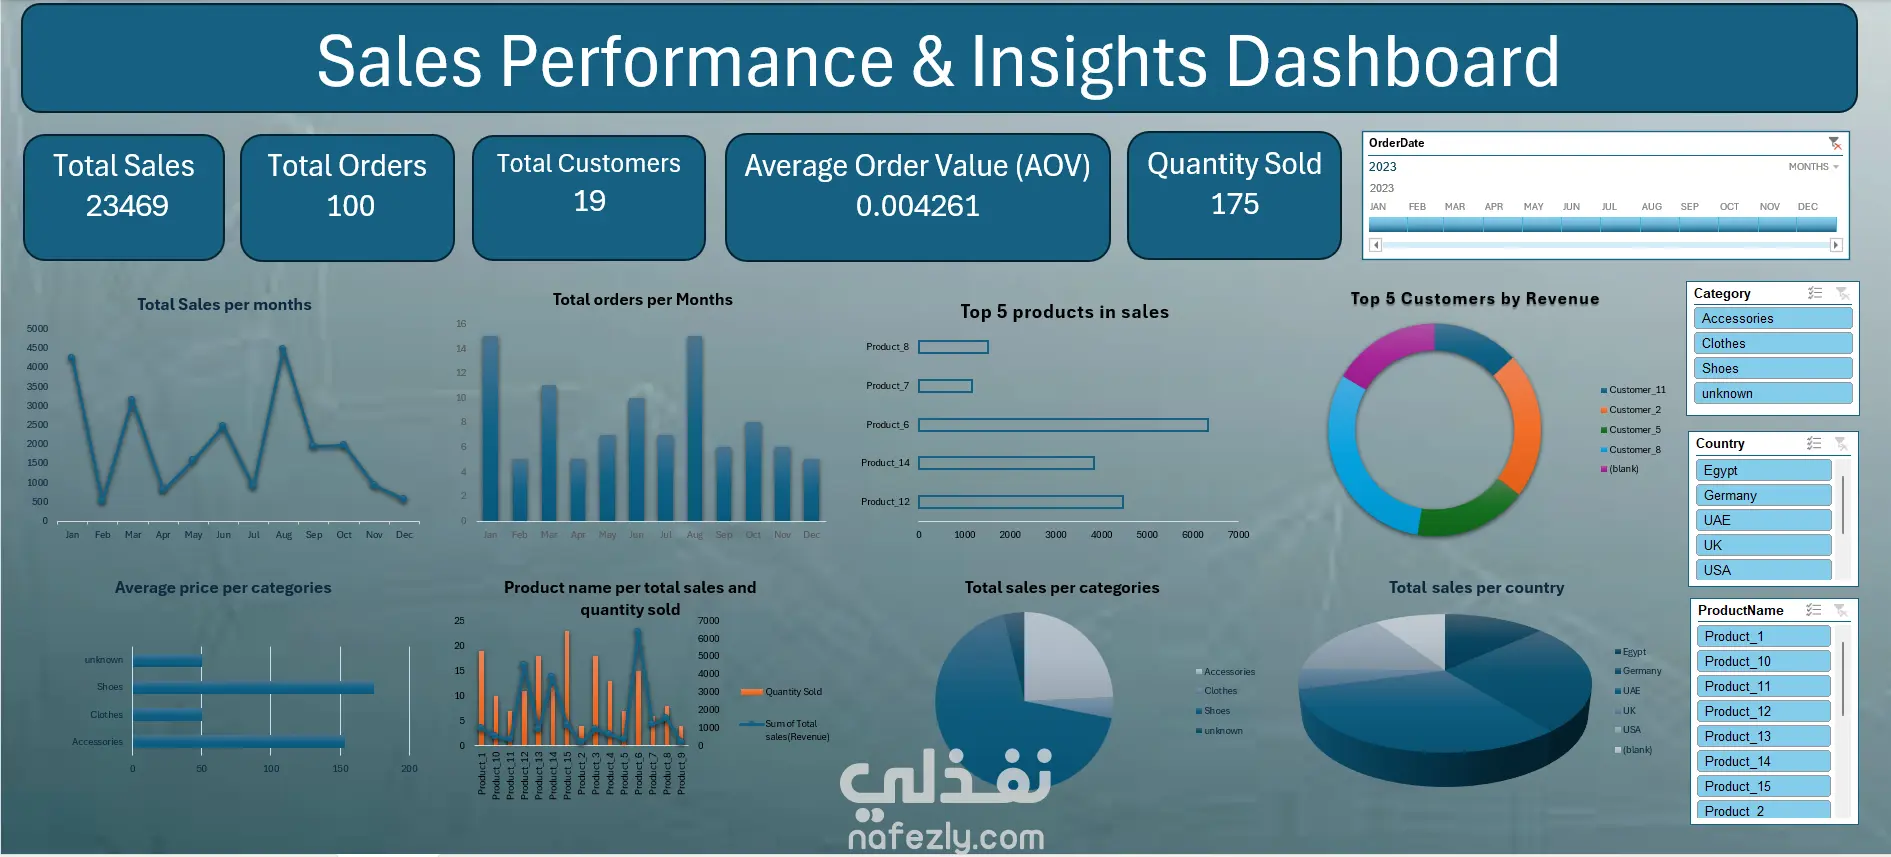
SUMMARY An interactive dashboard built using Excel to analyze sales performance and generate actionable business insights. The project involved data cleaning, transformation, and analysis using Excel, along with creating dynamic KPIs, charts, and slicers for enhanced interactivity. The dashboard provides a comprehensive overview of sales trends, customer behavior, product performance, and geographic distribution to support data-driven decision-making. Key Insights: -Sales performance shows monthly fluctuations, with noticeable peaks during mid-year, suggesting possible seasonal trends. -A small number of products generate a significant portion of total revenue, indicating a strong product concentration. -Revenue contribution is uneven across customers, with top customers driving a large share of total sales. -Certain categories, such as Accessories, outperform others, while some categories show lower sales performance. -Sales distribution varies by country, with specific regions contributing more to overall revenue. -There is a clear difference between quantity sold and total revenue for some products, indicating variations in pricing strategies and product value. Recommendation Focus on promoting top-performing products to maximize revenue growth. Improve performance of low-selling categories through targeted marketing strategies. Strengthen relationships with high-value customers while expanding the overall customer base. Increase investment in high-performing regions and explore opportunities in underperforming markets.
مهارات العمل
بطاقة العمل

طلب عمل مماثل




