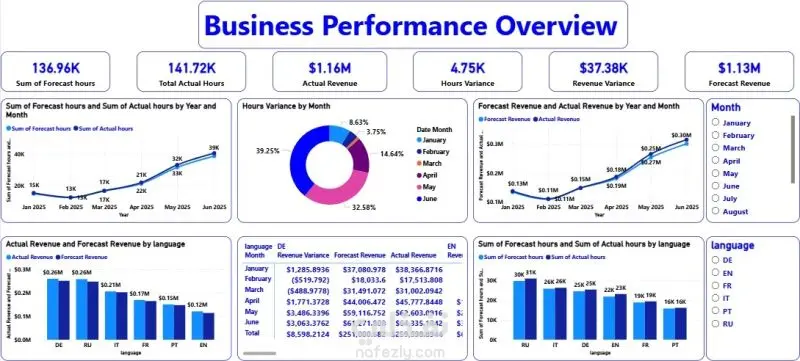
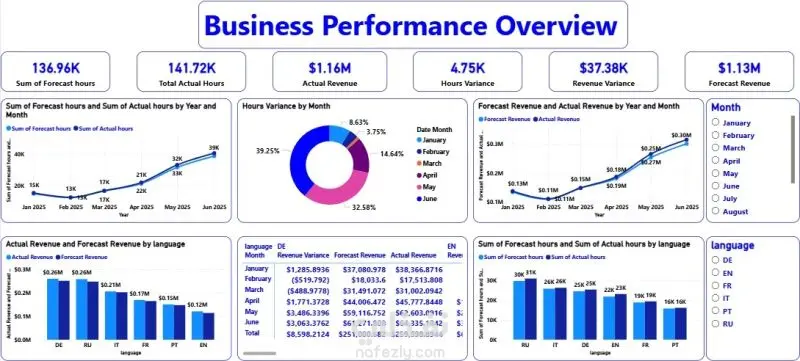
A high-end, interactive Power BI Dashboard designed to bridge the gap between operational efficiency and financial growth. This project tracks and analyzes core business KPIs, focusing on Revenue and Resource Utilization (Hours), while providing deep insights into Actual vs. Forecasted performance across multiple timeframes and language segments.
Key Features & Technical Accomplishments:
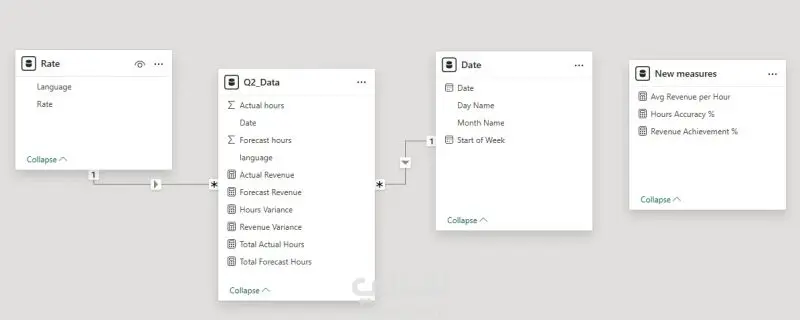
Advanced Data Modeling: Implemented a clean, optimized Star Schema architecture linking the central Fact table with dedicated dimension tables (Date and Rate) for maximum query performance.
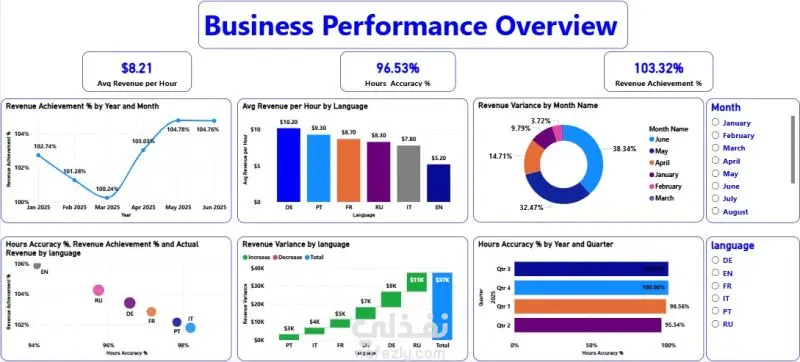
Complex DAX Calculations: Developed custom business logic and metrics including Revenue Achievement %, Hours Accuracy %, and Avg Revenue per Hour.
Dynamic Data Storytelling: Created highly intuitive visuals such as Waterfall charts for profit variance analysis, Scatter plots for language profitability mapping, and interactive trend lines.
Fully Interactive: Equipped with seamless cross-filtering and responsive slicers (Month/Language) for on-the-fly root-cause analysis.
Business Value:
Perfect for multi-lingual service providers, BPOs, or global agencies. This dashboard empowers stakeholders to monitor financial health ($1.16M total revenue tracked), evaluate team forecasting accuracy, and identify the most profitable business segments instantly.