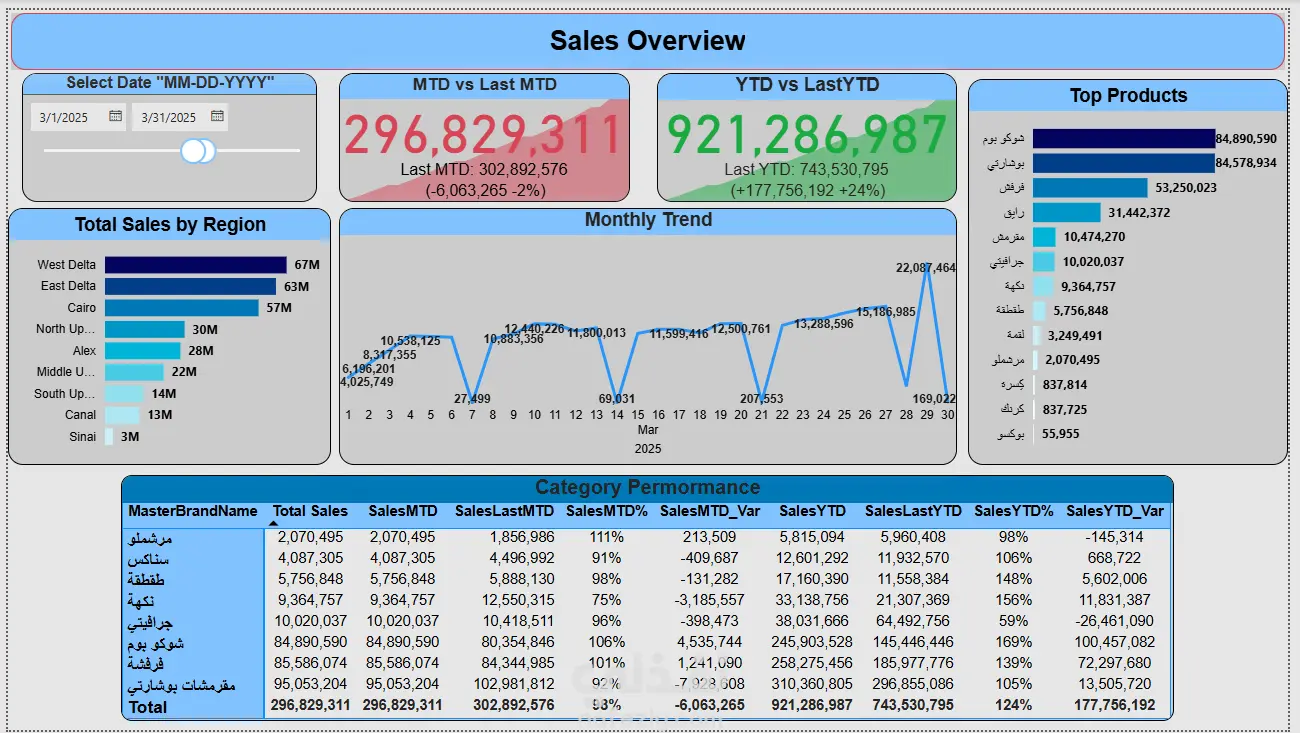
Designed and developed an interactive Sales Performance Dashboard using Power BI to analyze sales data across regions, products, and time periods.
The dashboard includes:
MTD & YTD sales tracking
Sales comparison with previous periods
Monthly sales trend analysis
Regional sales performance
Top-selling products visualization
Dynamic filtering by date
Tools & technologies used:
Power BI
Power Query
DAX
Data Modeling
Data Visualization
The project helps businesses monitor KPIs, identify sales trends, and support data-driven decision-making