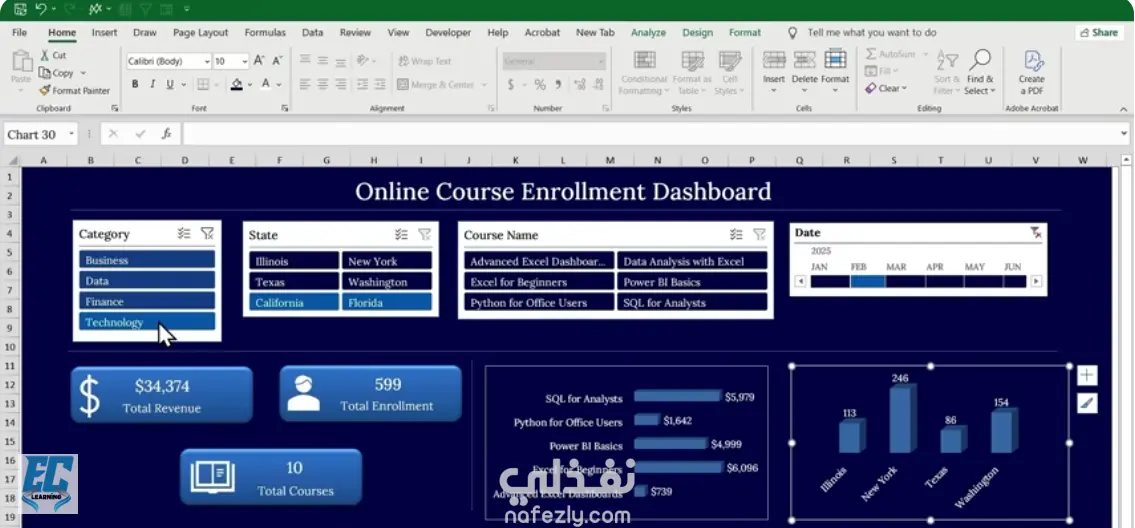
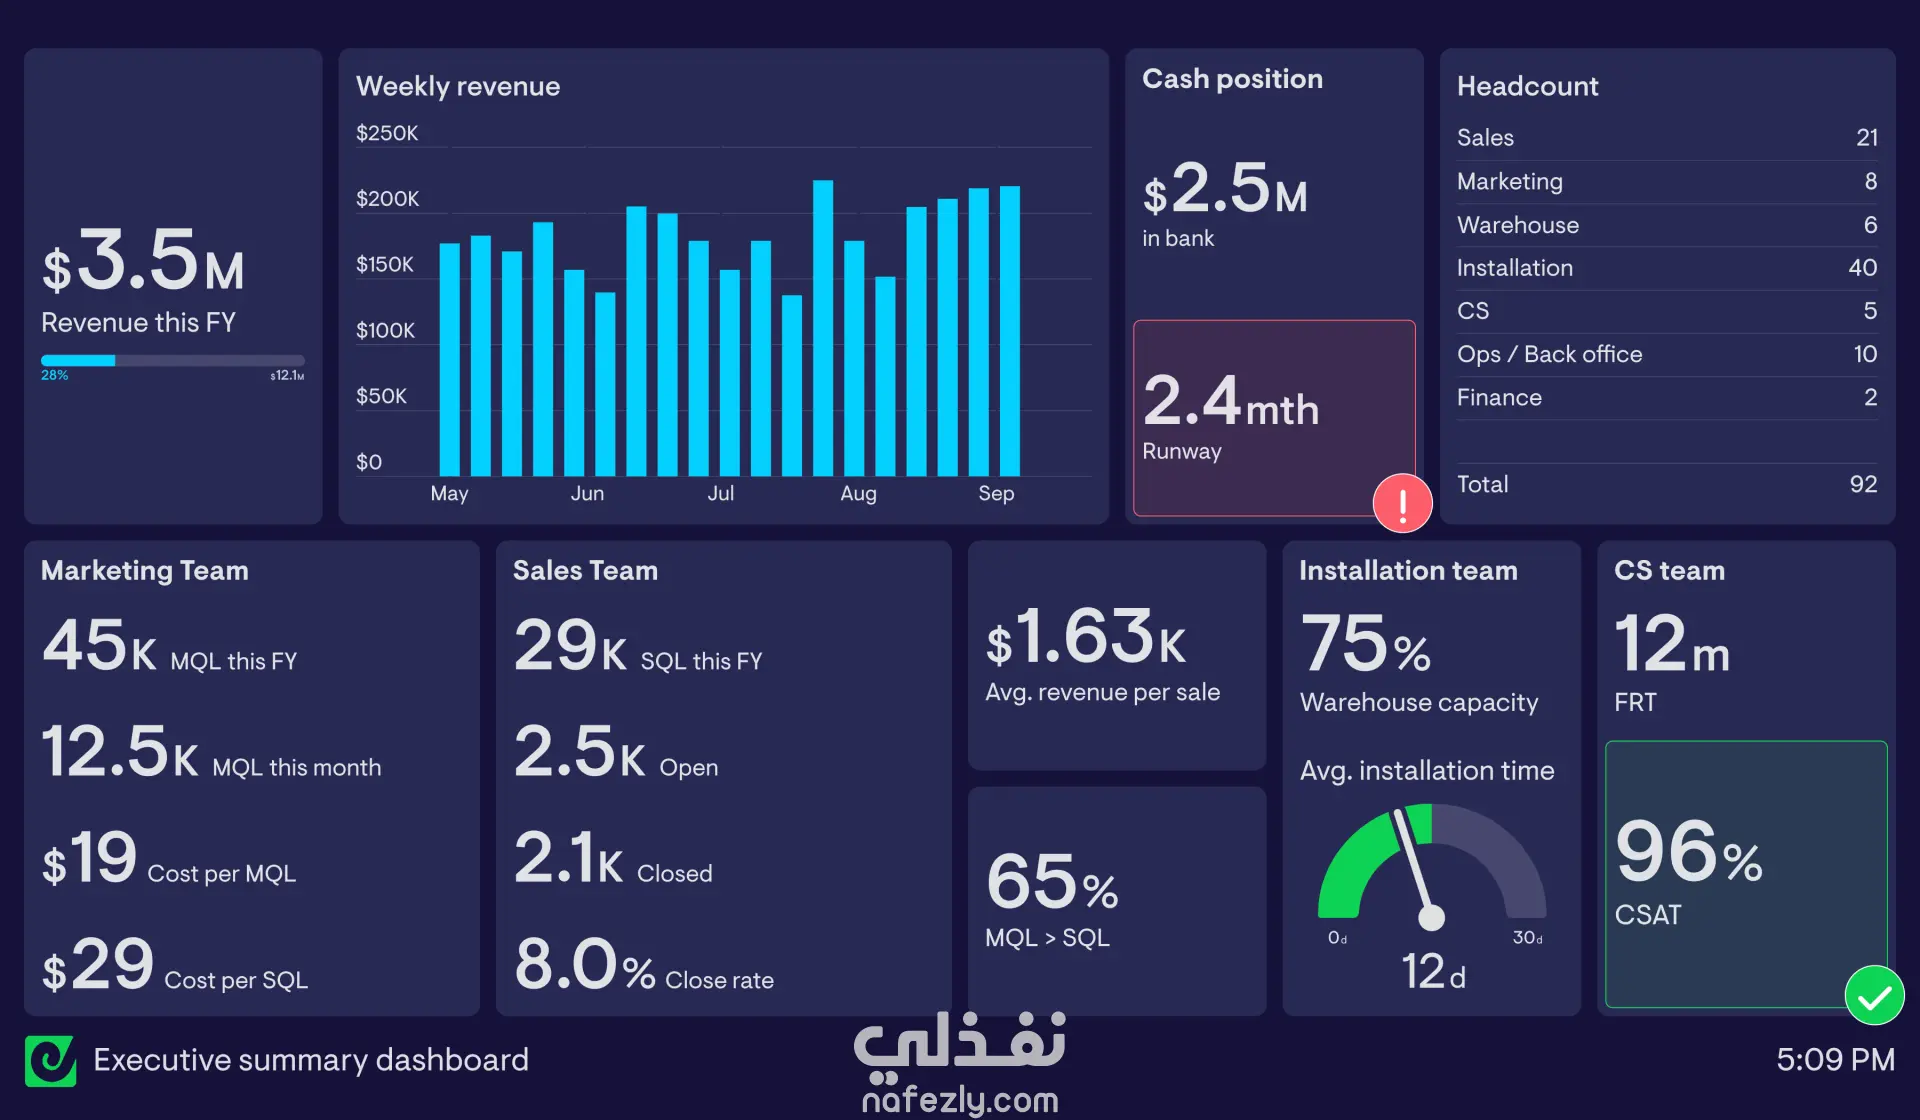
Designed and implemented a dynamic Executive Enrollment Dashboard to monitor the financial and operational performance of an online education platform. The project focused on consolidating disparate data sets into a unified visual interface for real-time decision-making.
Technical Implementation:
Developed complex Power Query scripts to automate data cleaning and transformation (ETL) from multiple sources.
Utilized Advanced DAX & Excel Formulas to calculate key financial metrics, including Total Revenue, Revenue per Course, and Geographic Performance.
Integrated Interactive Slicers (Category, State, Course Name, and Date) to allow stakeholders to perform multi-dimensional drill-down analysis.
Key Accounting & Financial Insights:
Enabled Revenue Variance Analysis across different US states (e.g., New York vs. Illinois).
Streamlined reporting efficiency by 70% through automation, replacing manual month-end reconciliation.
Visualized Enrollment Trends to identify high-margin product categories (Technology vs. Finance).