Clothing Store Dashboard
تفاصيل العمل
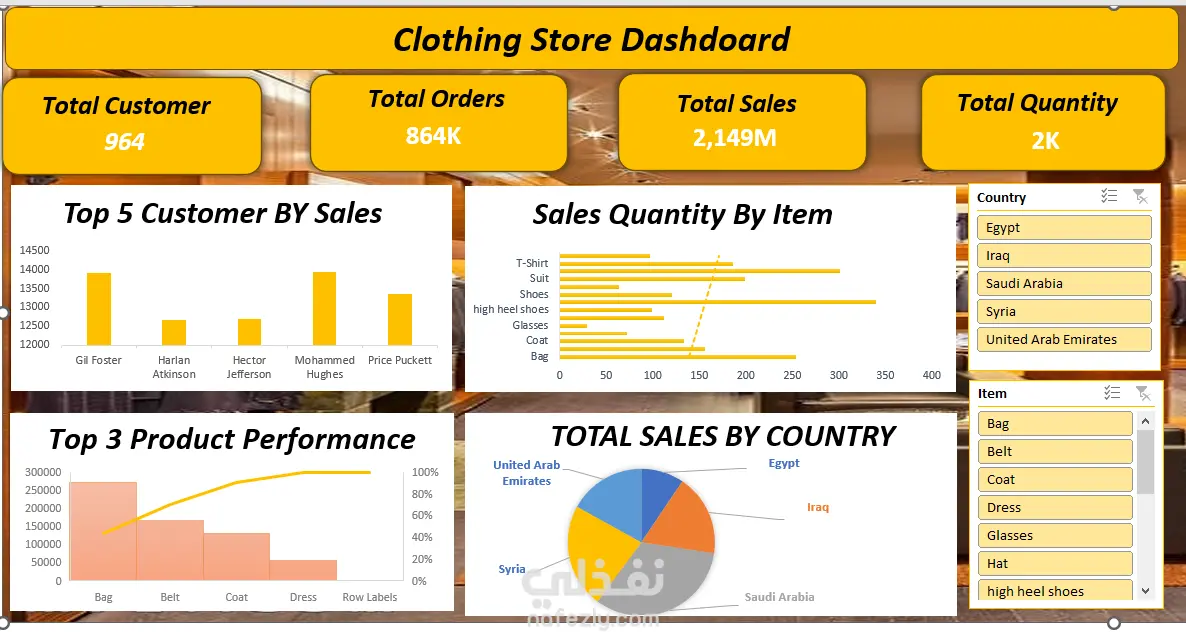
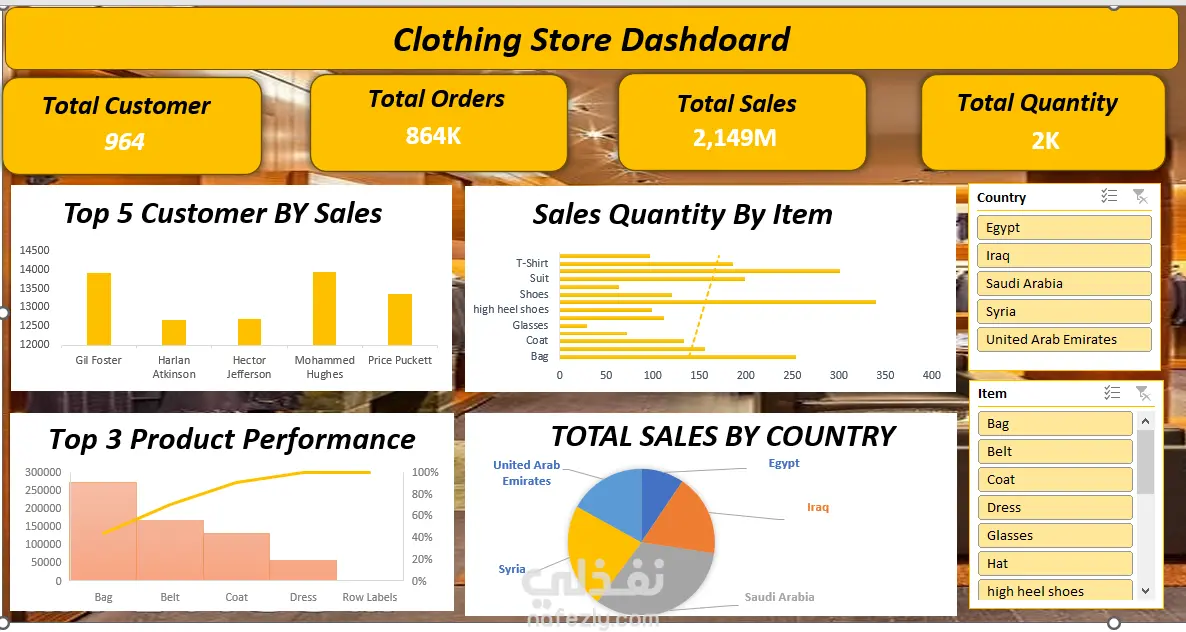
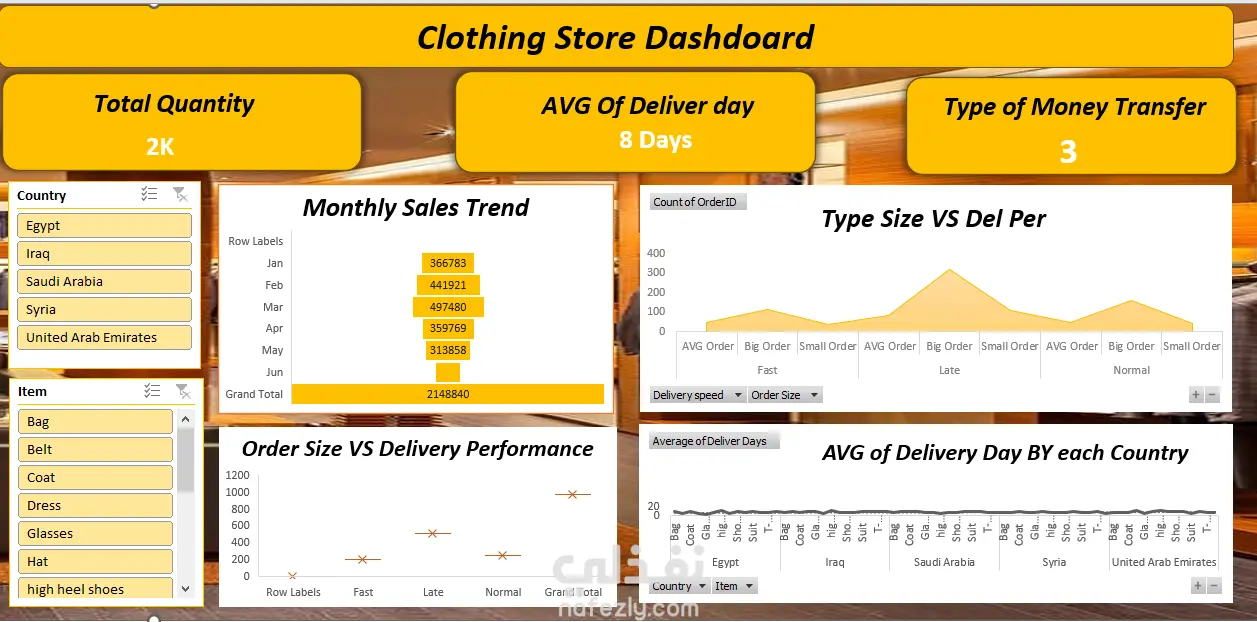
This project is an interactive Excel dashboard designed to analyze a clothing store’s sales and delivery performance. It provides a comprehensive view of business operations by combining sales metrics, customer insights, and logistics performance in a single interface. The dashboard includes key performance indicators such as total sales, total orders, total customers, total quantity, average delivery days, and payment methods. It also highlights top customers by sales, top-performing products, and sales distribution across different countries. Additionally, the project analyzes monthly sales trends to track business growth over time and identifies seasonal patterns. It also focuses on delivery performance by comparing order size with delivery speed, helping to evaluate operational efficiency. Interactive slicers (Country & Item) are used to filter the data dynamically, allowing users to explore insights and make data-driven decisions easily. Key Features Sales & Customer KPIs Monthly Sales Trend Analysis Top Customers & Product Performance Delivery Performance Analysis (Speed vs Order Size) Average Delivery Time by Country Interactive Filters (Slicers) Tools & Techniques Microsoft Excel Pivot Tables & Pivot Charts Slicers for interactivity Data Cleaning & Transformation Business Value Monitor overall sales performance Identify best-selling products and loyal customers Analyze delivery efficiency and logistics Support data-driven decision making
بطاقة العمل

طلب عمل مماثل




