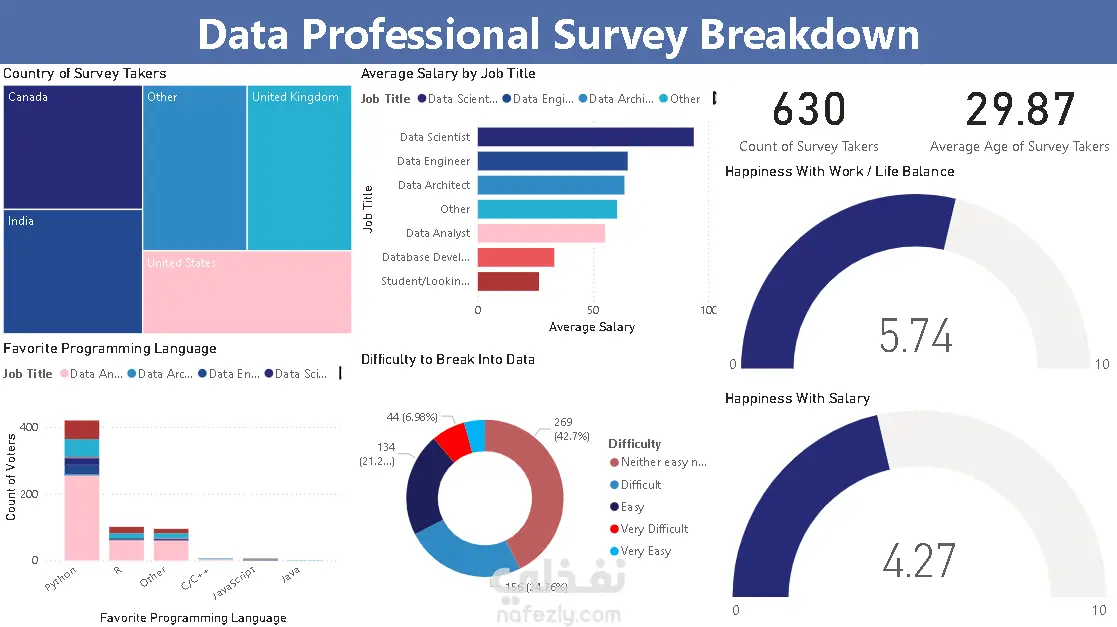
This project presents a professional analysis of a global survey of data professionals. The objective was to extract meaningful business insights related to compensation, work preferences, tool usage, and demographic trends. The analysis was performed using Power BI, with data transformation handled in Power Query and business logic implemented using DAX.
📌 Objective
To design and deliver an interactive Power BI dashboard that enables stakeholders to:
Understand trends in salary satisfaction and work-life balance.
Analyze tool preferences across the data industry.
Evaluate demographic patterns to support strategic workforce planning.
Examine the relationship between remote work and job satisfaction.
🛠 Tools & Technologies
Power BI – Data visualization, report design
DAX – KPI calculations and logic implementation
Power Query – Data transformation and cleaning
Conditional Formatting – Gradient visuals for clearer insight presentation
🔍 Key Insights
Salary Satisfaction: 40% of respondents were satisfied with their current compensation.
Work-Life Balance: 57% of participants reported satisfaction with their work-life balance.
Tool Usage: Python (40%) and SQL (30%) were the most commonly used programming languages.
Demographics: Average age of respondents was 29 years.
Geographic Distribution: 50% of responses originated from the US and UK.
Remote Work: Remote professionals reported 15% higher job satisfaction on average.
📈 Dashboard Features
KPI cards for average salary, satisfaction scores, and respondent age
Bar and pie charts for tool preferences and work modes
Map visual to display country-wise participation
Conditional formatting for dynamic insights
DAX-driven metrics to analyze job satisfaction by work