Final Project
تفاصيل العمل
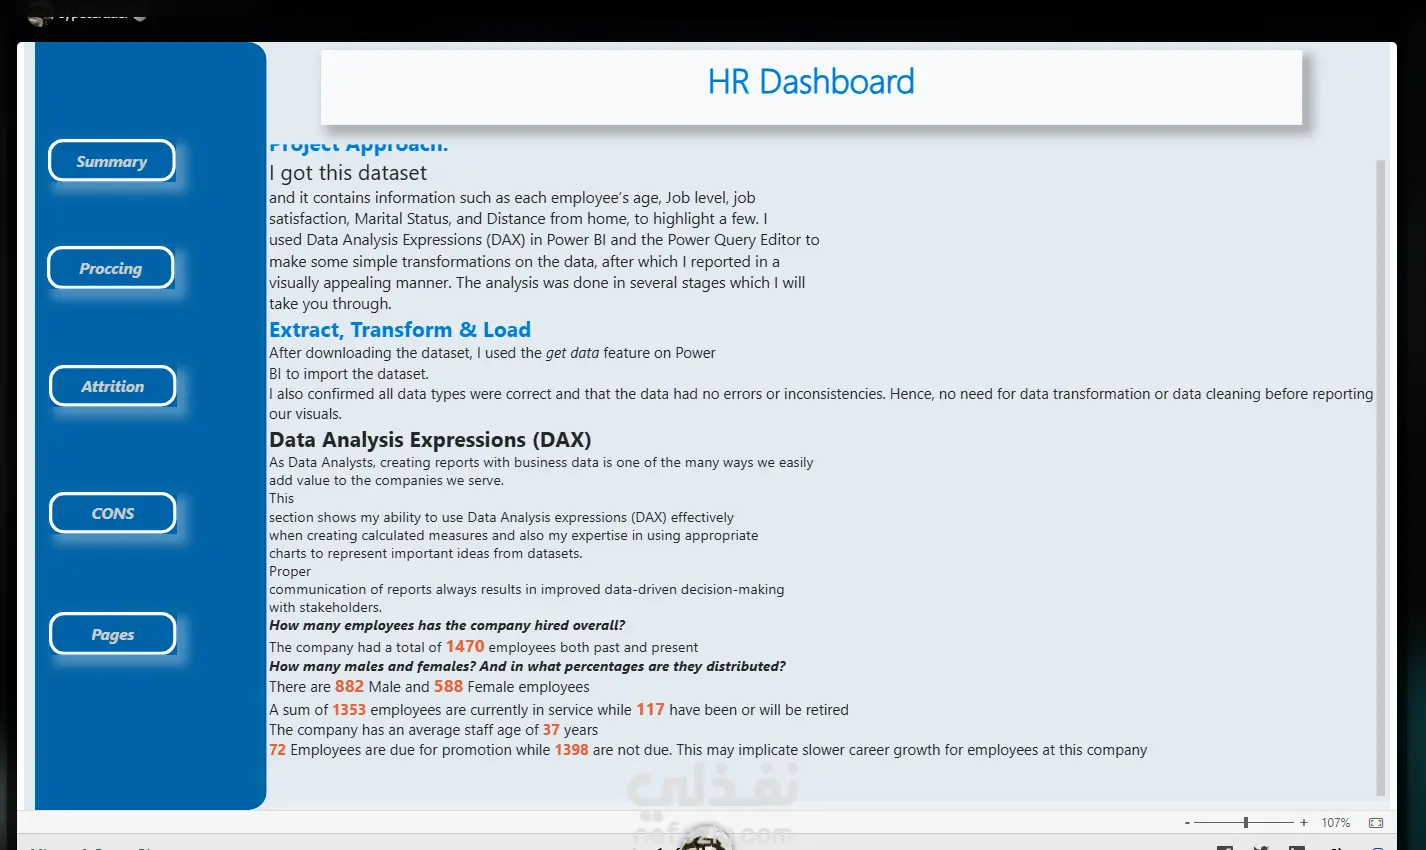
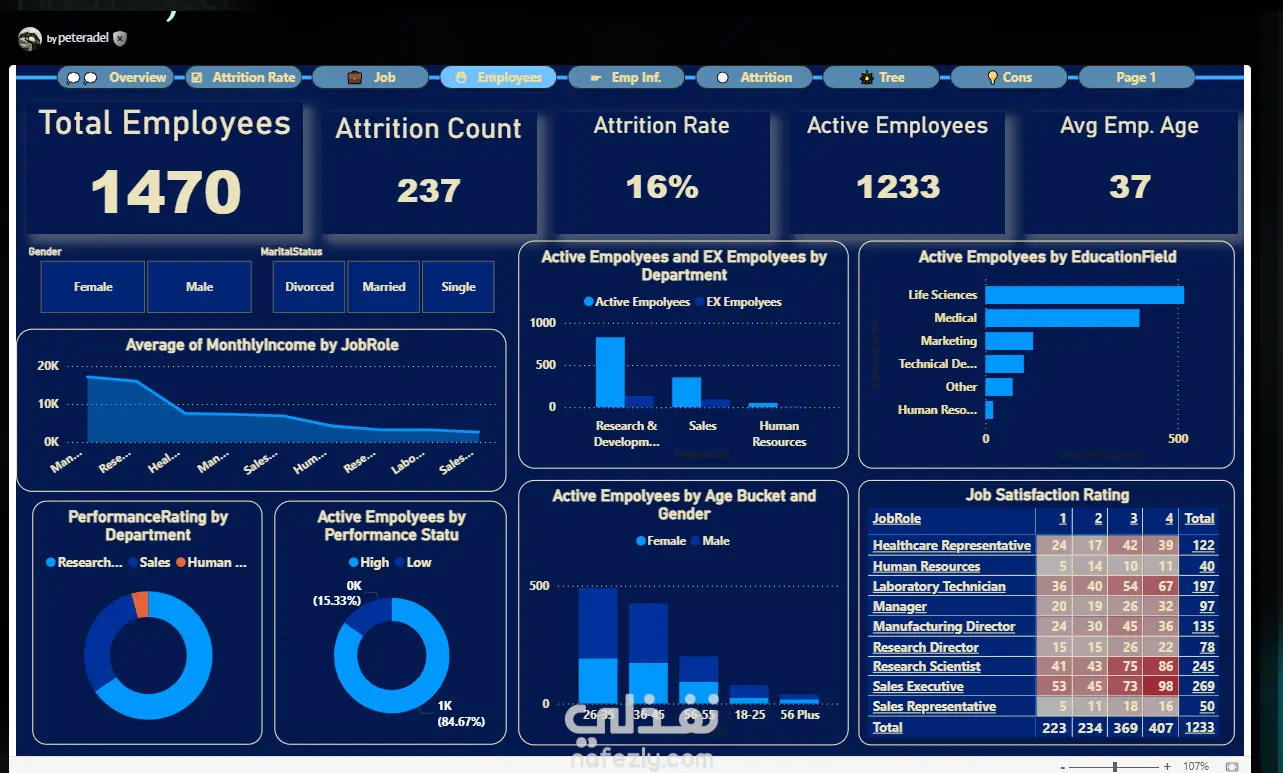
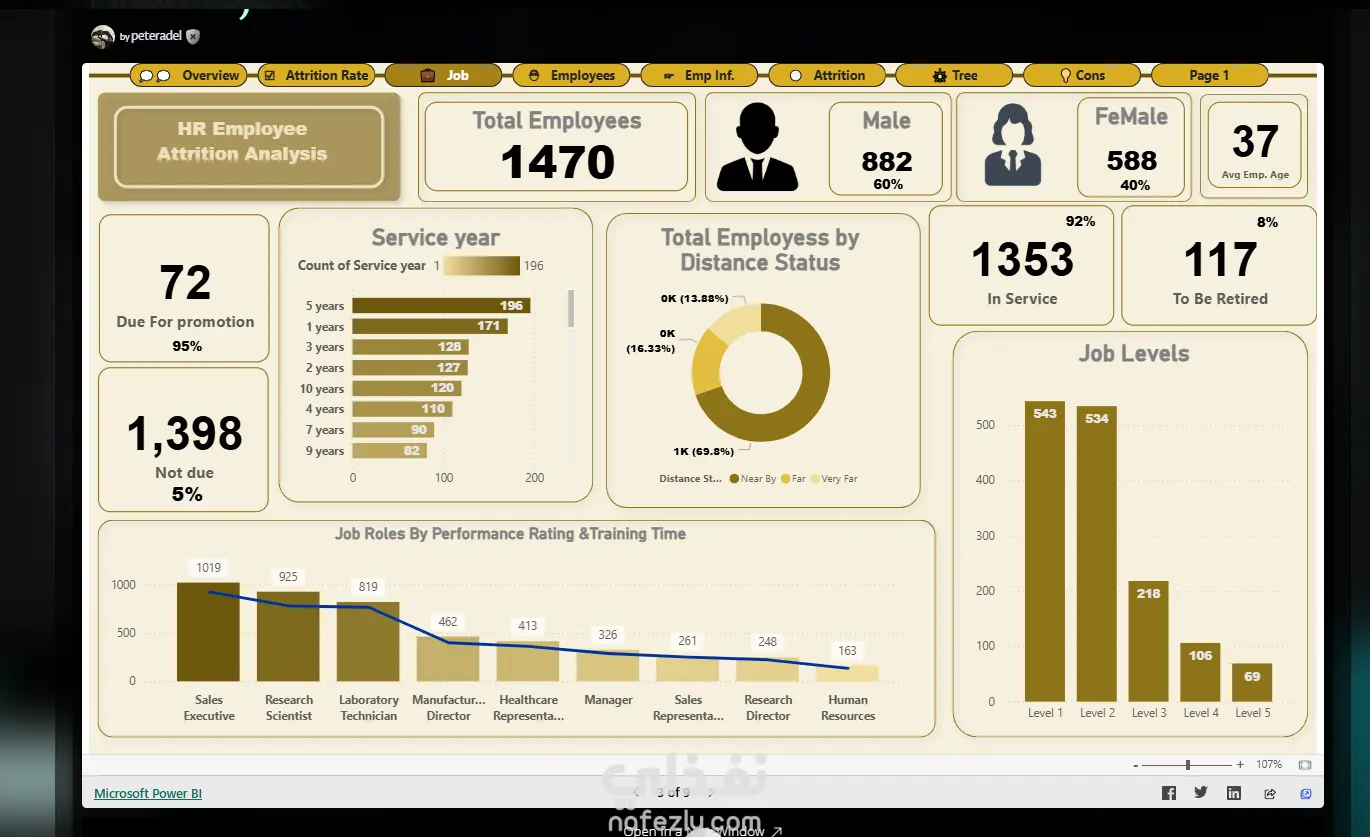
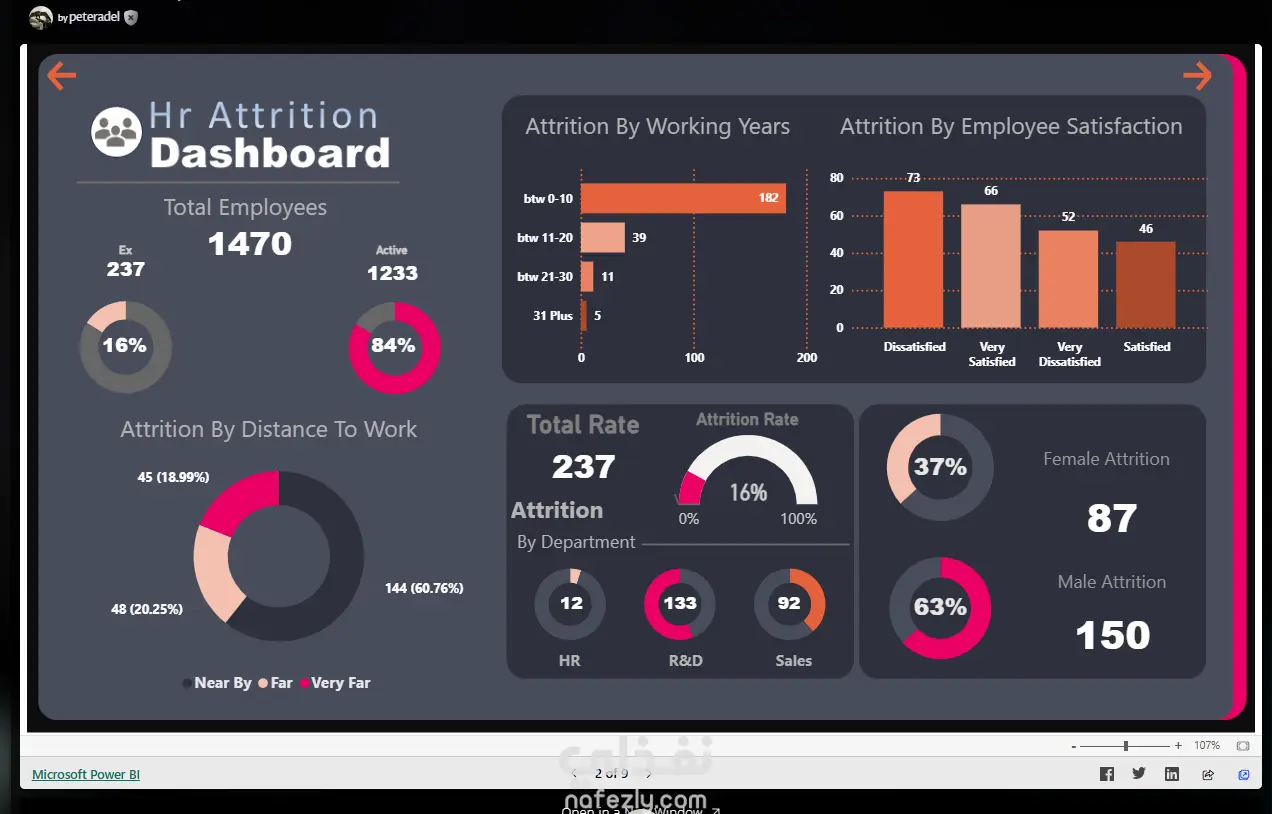
Project Approach: I got this dataset and it contains information such as each employee’s age, Job level, job satisfaction, Marital Status, and Distance from home, to highlight a few. I used Data Analysis Expressions (DAX) in Power BI and the Power Query Editor to make some simple transformations on the data, after which I reported in a visually appealing manner. The analysis was done in several stages which I will take you through. Extract, Transform & Load After downloading the dataset, I used the get data feature on Power BI to import the dataset. I also confirmed all data types were correct and that the data had no errors or inconsistencies. Hence, no need for data transformation or data cleaning before reporting our visuals. Data Analysis Expressions (DAX) As Data Analysts, creating reports with business data is one of the many ways we easily add value to the companies we serve. This section shows my ability to use Data Analysis expressions (DAX) effectively when creating calculated measures and also my expertise in using appropriate charts to represent important ideas from datasets. Proper communication of reports always results in improved data-driven decision-making with stakeholders.
مهارات العمل
بطاقة العمل

طلب عمل مماثل




