This project focuses on understanding, cleaning, transferring, analyzing, and presenting financial data using Microsoft Excel.
تفاصيل العمل
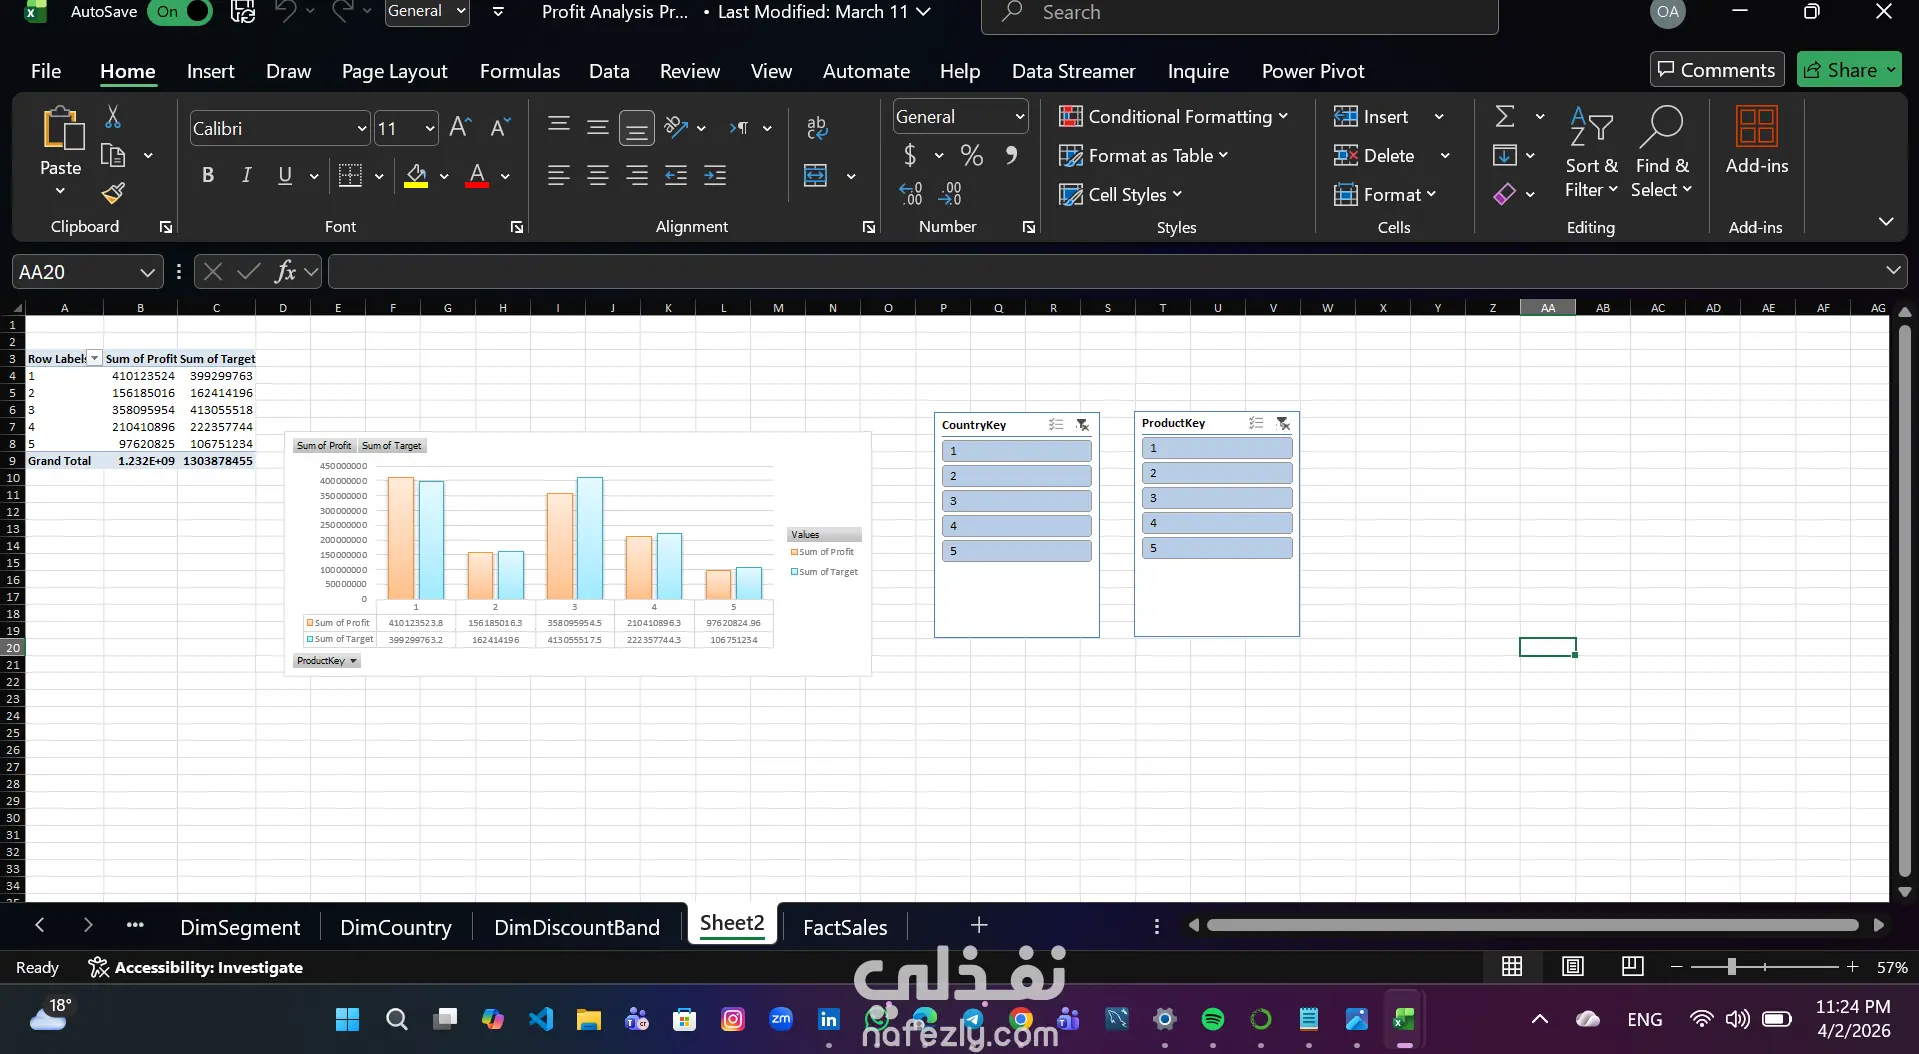
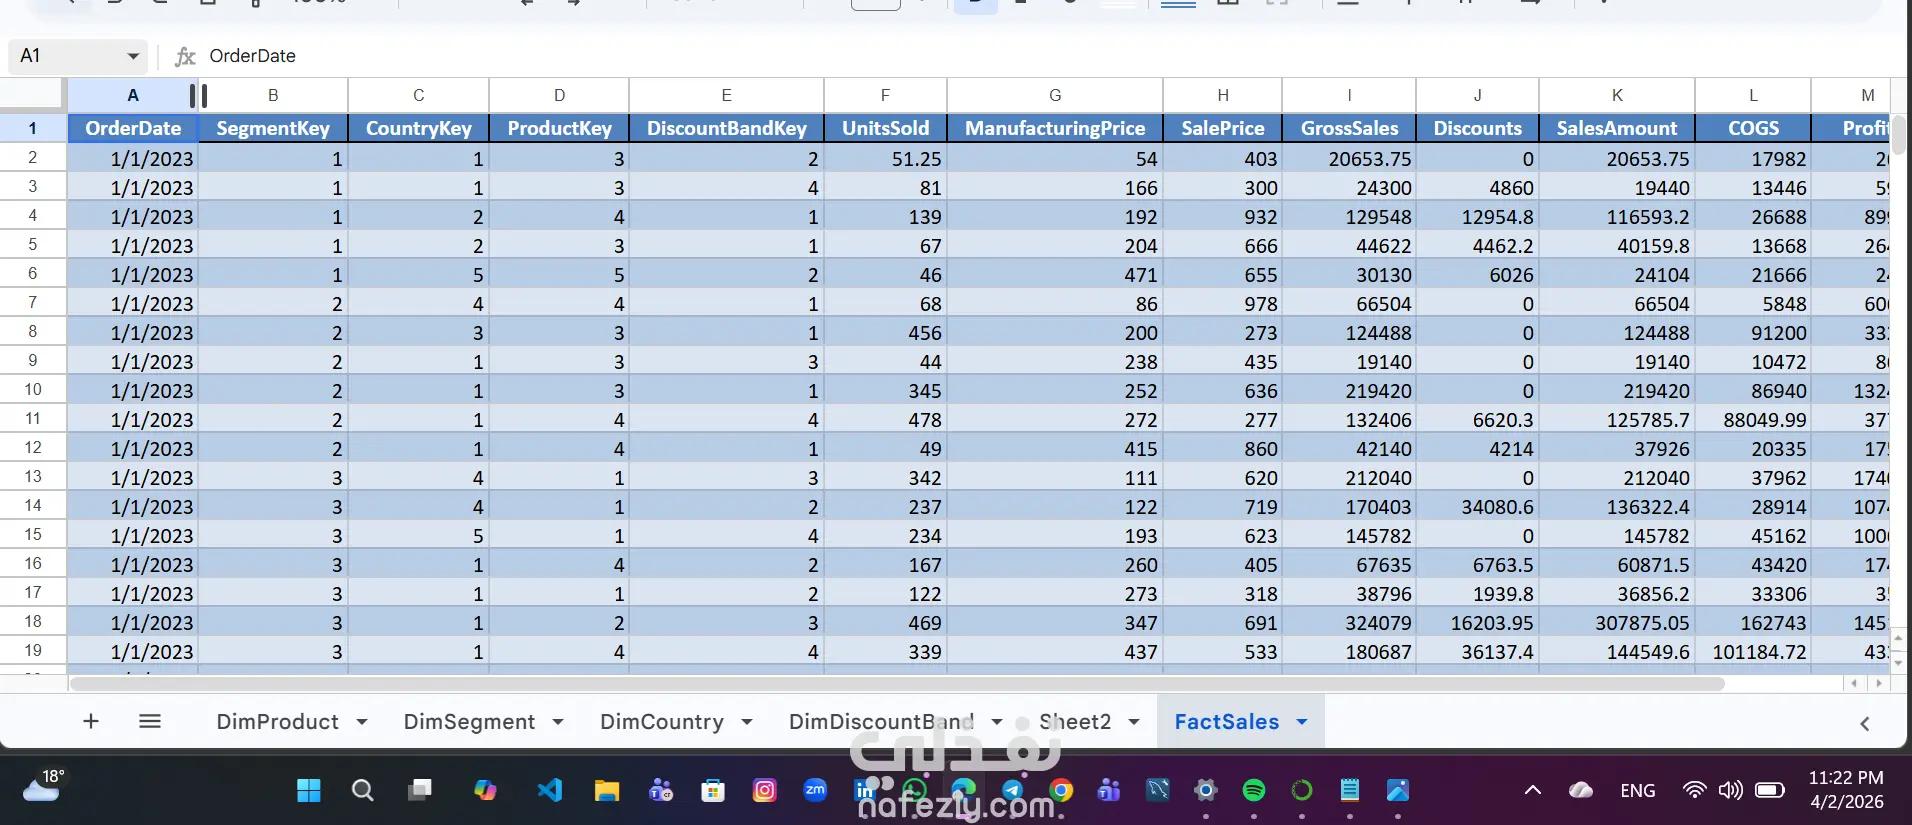
1. Data Architecture The project follows a Star Schema structure, as evidenced by the tabs at the bottom of the workbook: FactSales: The core table containing transactional data (sales, profit, costs). Dimension Tables (DimSegment, DimCountry, DimDiscountBand): These tables provide descriptive attributes to filter and group the sales data. 2. Key Visual Components The dashboard on "Sheet2" is designed for interactive analysis: Pivot Table (Top Left): Summarizes the raw data, showing Sum of Profit and Sum of Target indexed by row labels (likely product or country IDs). Clustered Column Chart with Data Table: * Orange bars: Represent actual profit. Blue bars: Represent target profit. This allows for an immediate visual comparison of where the business is meeting or missing its goals. Slicers (CountryKey & ProductKey): These interactive buttons allow users to filter the entire dashboard by specific countries or products with a single click. 3. Project Objectives The primary goal of this project is Performance Monitoring. Specifically: Variance Analysis: Identifying which products or regions are underperforming relative to their targets. Profitability Insights: Seeing the total scale of profit (the Grand Total shows a value of approximately 1.23 billion). Interactive Reporting: Moving away from static tables to a dynamic environment where a manager can drill down into specific segments.
مهارات العمل