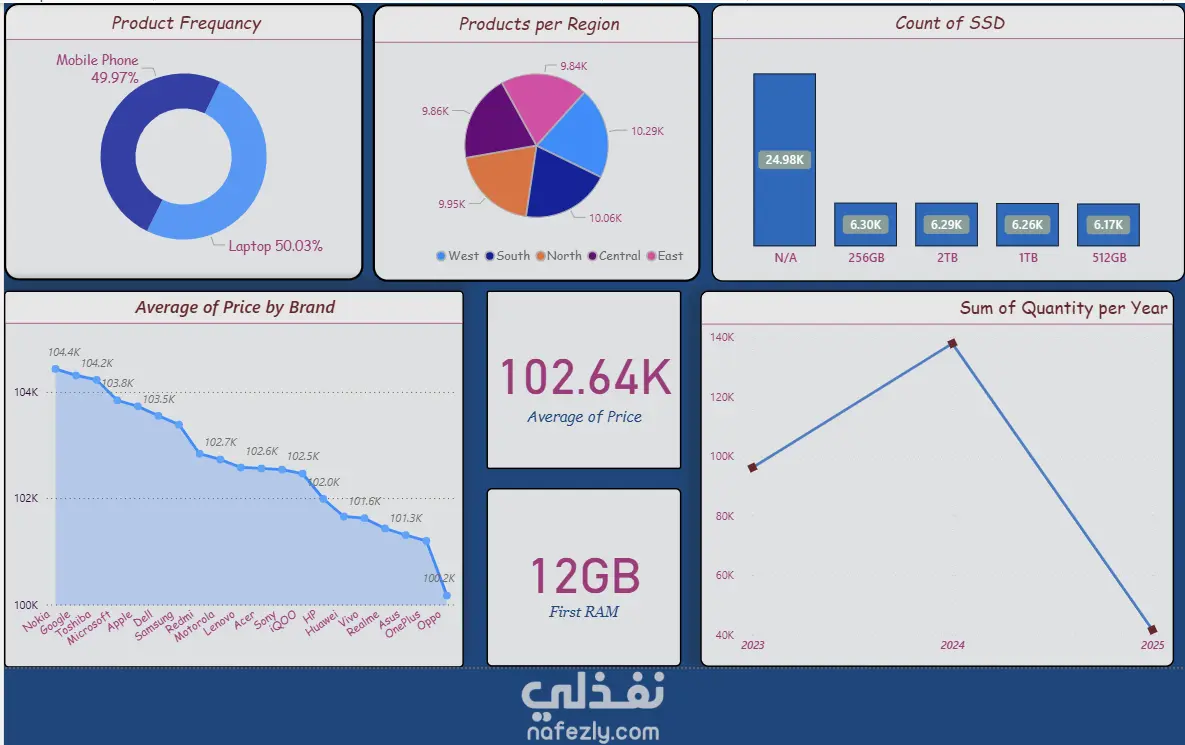
Here is a professional and concise English description for your **Mobile & Laptop Sales Dashboard** project. This description highlights both the technical skills and the business value of the analysis.
---
This project focuses on analyzing the electronics market, specifically comparing the sales performance pricing trends, and customer preferences for mobile devices and laptops.
1. Data Cleaning & Integration:
Streamlined the dataset by handling missing values and ensuring consistent technical specifications (RAM, Storage, Processor) for both categories.
Categorized products into "Budget," "Mid-Range," and "Premium" segments to better understand market distribution.
2. Key Insights & Analytics:
Brand Performance: Identified top-selling brands and their market share within the mobile and laptop sectors.
Price-to-Feature Correlation: Analyzed how specific hardware upgrades (e.g., SSD capacity or Camera resolution) impact the final retail price.
Customer Demand: Evaluated which configurations are most popular among users, helping to forecast inventory needs.
Python: Used for Exploratory Data Analysis (EDA) and identifying correlations between technical specs and user ratings.
4. Final Visualization (Power BI):
Built a comprehensive, interactive dashboard with **Real-time KPIs** (Total Units Sold, Average Sales Price, Most Popular Brand).
Integrated "Slicers" to allow users to filter data by Brand, Price Range, or Date, providing a customized view of the electronics market.