Sales Dashboard

تفاصيل العمل
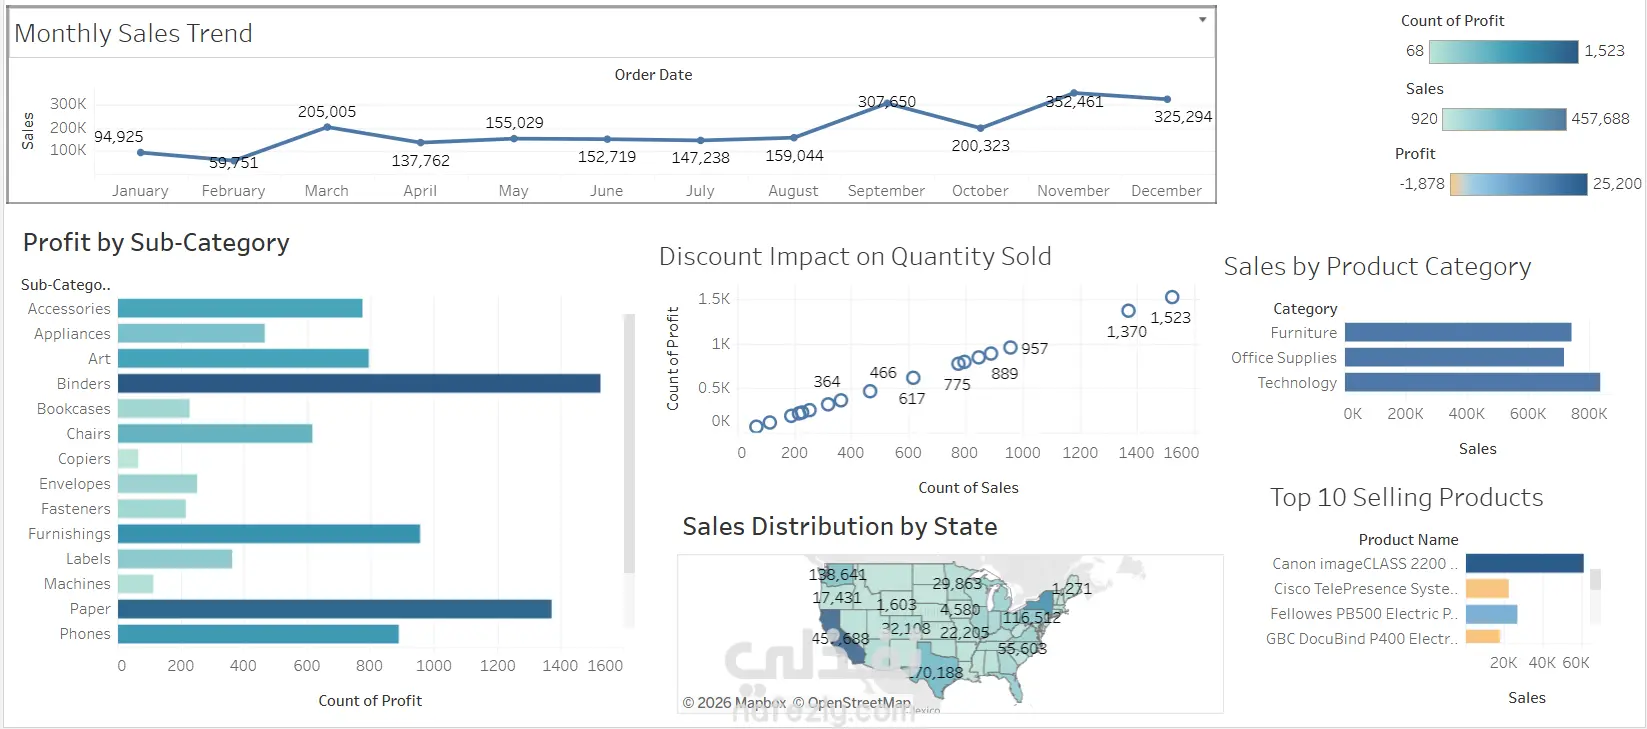
I created this Sales Dashboard to help businesses track their sales and profit performance in a clear, visual way. I focused on making it realistic, professional, and easy to understand, just like a dashboard you’d see in a corporate setting. What I included in this project: Monthly Sales Trend: Line chart showing sales month by month. Profit by Sub-Category: Horizontal bar chart to see which product sub-categories are most profitable. Discount Impact on Quantity Sold: Scatter plot to analyze how discounts affect sales and profit. Sales by Product Category: Column chart for Furniture, Office Supplies, and Technology. Top 10 Selling Products: Ranked bar chart highlighting best-sellers. Sales Distribution by State: Map visualization to see where sales are coming from geographically
بطاقة العمل

طلب عمل مماثل




